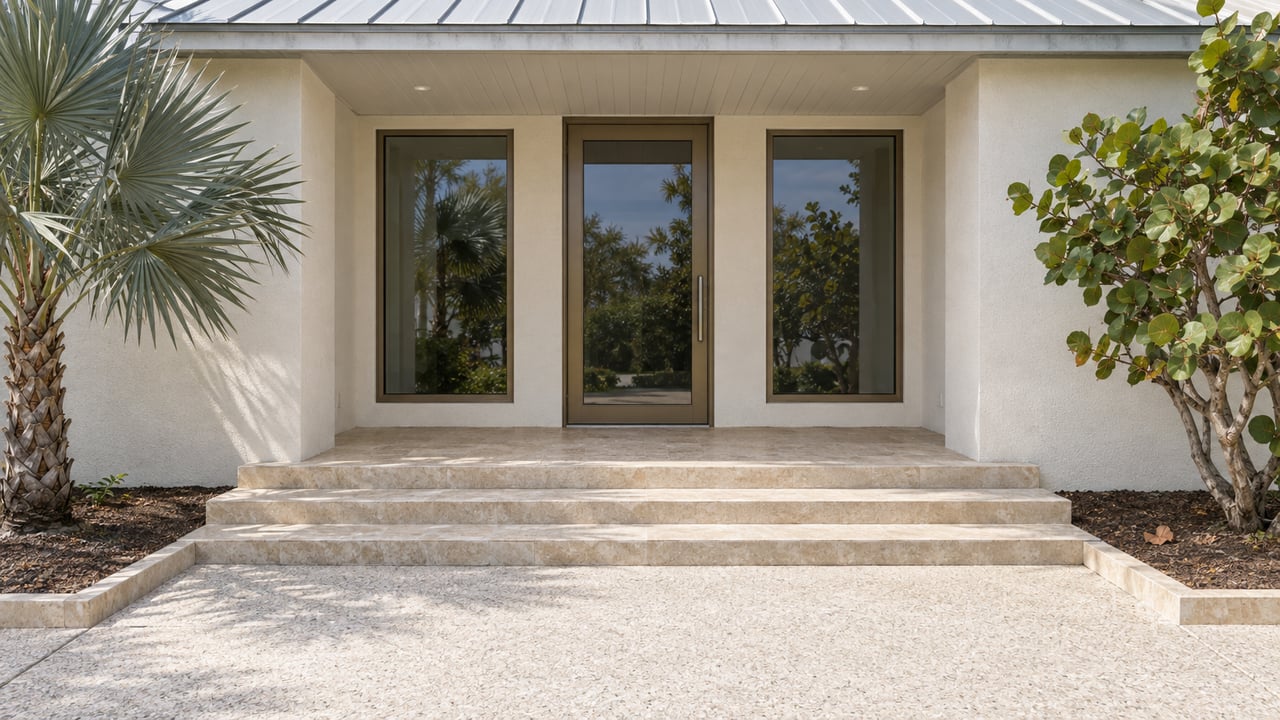
Pull up the MLS for Key Largo, Islamorada, or Tavernier this week and the results come up sparse, with only a handful of homes to scroll through. A buyer comparing the Upper Keys against other second-home markets right now could be forgiven for reading that thin page as a market losing steam, a good excuse to wait for spring when more houses show up.
That read has the mechanics backward. A Keys-wide market report covered by keysnews.com shows that local listings follow a predictable annual shape: they peak in February and hit their lowest point in September, a pattern the report expected to hold for the rest of 2026. This is that month. And the same report shows what actually happens during the thin stretch: during the first quarter of 2026, Keys-wide sales rose 13.6 percent year over year, from 513 to 583, while the average sale price climbed 13.4 percent, from $1,073,416 to $1,217,148, even as total active listings for the same period fell 3 percent, from 2,357 to 2,286. Fewer homes on the market. More of them selling, for more money.
The Arithmetic Nobody Puts on a Listing Sheet
The report's own explanation for that pattern is worth sitting with: it points to a long-standing economic reality that an inverse relationship exists between the number of sales and the number of sellers. That sounds abstract until you translate it into what a buyer actually experiences. A market with a fixed number of interested buyers and a shrinking number of willing sellers does not get quieter. It gets tighter. Every seller who does list in a low month is negotiating from a position where the report notes sellers required fewer and smaller price reductions to get a home under contract in the first quarter of 2026 than they did the year before.
The report attributes the entire dynamic to something structural rather than seasonal sentiment: the Keys have a naturally restricted geography and a limited land supply, so the local market runs on supply, not on swings in buyer enthusiasm. That is a different mechanism than most mainland housing markets, where builders can respond to demand by adding lots. There is no equivalent release valve on a chain of islands connected by a single highway.
One MLS, One Calendar, Every Island
It helps to understand that this is not a Key Largo pattern, an Islamorada pattern, and a separate Tavernier pattern running on their own clocks. Every active listing in the Upper Keys, whatever the town, feeds through the same multiple listing service, so the Keys-wide calendar is the same calendar governing all three at once. A buyer who narrows a search to one town is not escaping the September trough. They are looking at a smaller slice of the identical curve.
Total active listings across the Keys fell 3 percent year over year in the first quarter of 2026, while the average sale price rose 13.4 percent over the same stretch.
That single line does more to explain a September search than any square footage filter will. The properties available this month are not a discount bin left over after the good ones sold. They are what a structurally supply-constrained market looks like at its tightest point of the year.
Why February Does Not Bring the Relief It Looks Like
The instinct to wait for spring rests on a reasonable assumption: more listings should mean more leverage. But the same report that documents the September trough also documents where the cycle is headed, describing an accelerated pace of sales moving forward compared to 2025. If that holds, the listings that appear in February arrive into a market already selling faster than it did the prior year, not into a lull waiting for buyers to show up.
In other words, the extra inventory in February does not sit still long enough to hand a buyer more negotiating room. It gets absorbed by the same wave of demand that has been building all year, plus whatever new competition shows up once more homes are visible to search. A thinner market in September and a fuller one in February are two different shapes of the same competitive pressure, not a quiet season followed by a loose one.
What Actually Tells You Something, Month to Month
Raw listing counts are the number everyone sees first and the least useful one to act on. A few things carry more signal:
- How much sellers are cutting their price before going under contract. The first quarter of 2026 saw smaller and less frequent reductions than the year before, a sign of a market where list price and sale price are converging, not drifting apart.
- How the sale-to-list ratio is moving, not just whether a home eventually sells. A shrinking gap between what a home is listed for and what it sells for says more about real competition than a headline inventory figure.
- Whether new listings are being replaced at the same pace they sell. A market can show a stable count of active listings and still be tightening hard underneath, if each one is getting absorbed almost as fast as it appears.
- The direction of average sale price over the same calendar window a year earlier, not against last month, since the Keys' own seasonal curve makes month-over-month comparisons misleading on their own.
None of these require waiting for a specific month. They require asking a different question than "how many listings are there."
A Few Questions Worth Asking Before You Time Anything
Does this mean September is a good month to buy? It means September is a month where the underlying competitive pressure is easy to misread as absence rather than tightness. Whether it is the right month for a specific buyer depends on financing, timeline, and what is actually available in the price range and location that matter, not on the calendar alone.
Do Key Largo, Islamorada, and Tavernier each have their own version of this cycle? The Keys-wide report does not break the seasonal curve down town by town, and because all three draw from the same regional MLS and the same finite land base, there is no evidence the underlying mechanism runs differently in one town than another. Differences between them are more likely to show up in price tier and property type than in the shape of the calendar.
If sellers are getting more of their asking price, does that mean it is a bad time to negotiate at all? It means the room to negotiate has narrowed compared to a year earlier, not that it has disappeared. A well-documented, accurately priced offer still works. A lowball approach calibrated to a softer market that no longer exists is what tends to fail.
The number worth carrying out of this is not the listing count on any given day. It is the relationship between how few sellers are listing and how quickly the ones who do are getting paid close to what they asked. That relationship, more than the size of the search results page, is what a buyer or seller in the Upper Keys is actually working against this month.
If you are trying to make sense of what a specific number of active listings in Key Largo, Islamorada, or Tavernier actually means for your search or your timeline to list, Islamorada Life Realty can walk through the current absorption pattern with you directly, in English, French, or Spanish, before you decide whether to act now or wait for a month that may not offer what it appears to promise.